 Submarius
A spearfishing map of reefs, wrecks and depths.
Last updated October 14, 2026
The reefs and wrecks layer in Submarius puts more than 380,000 mapped reefs, wrecks, obstructions, dive sites and platforms on one map (as of August 2026). Tap any of them for the depth, the sources behind it, and the conditions at that spot. It's a Pro layer.
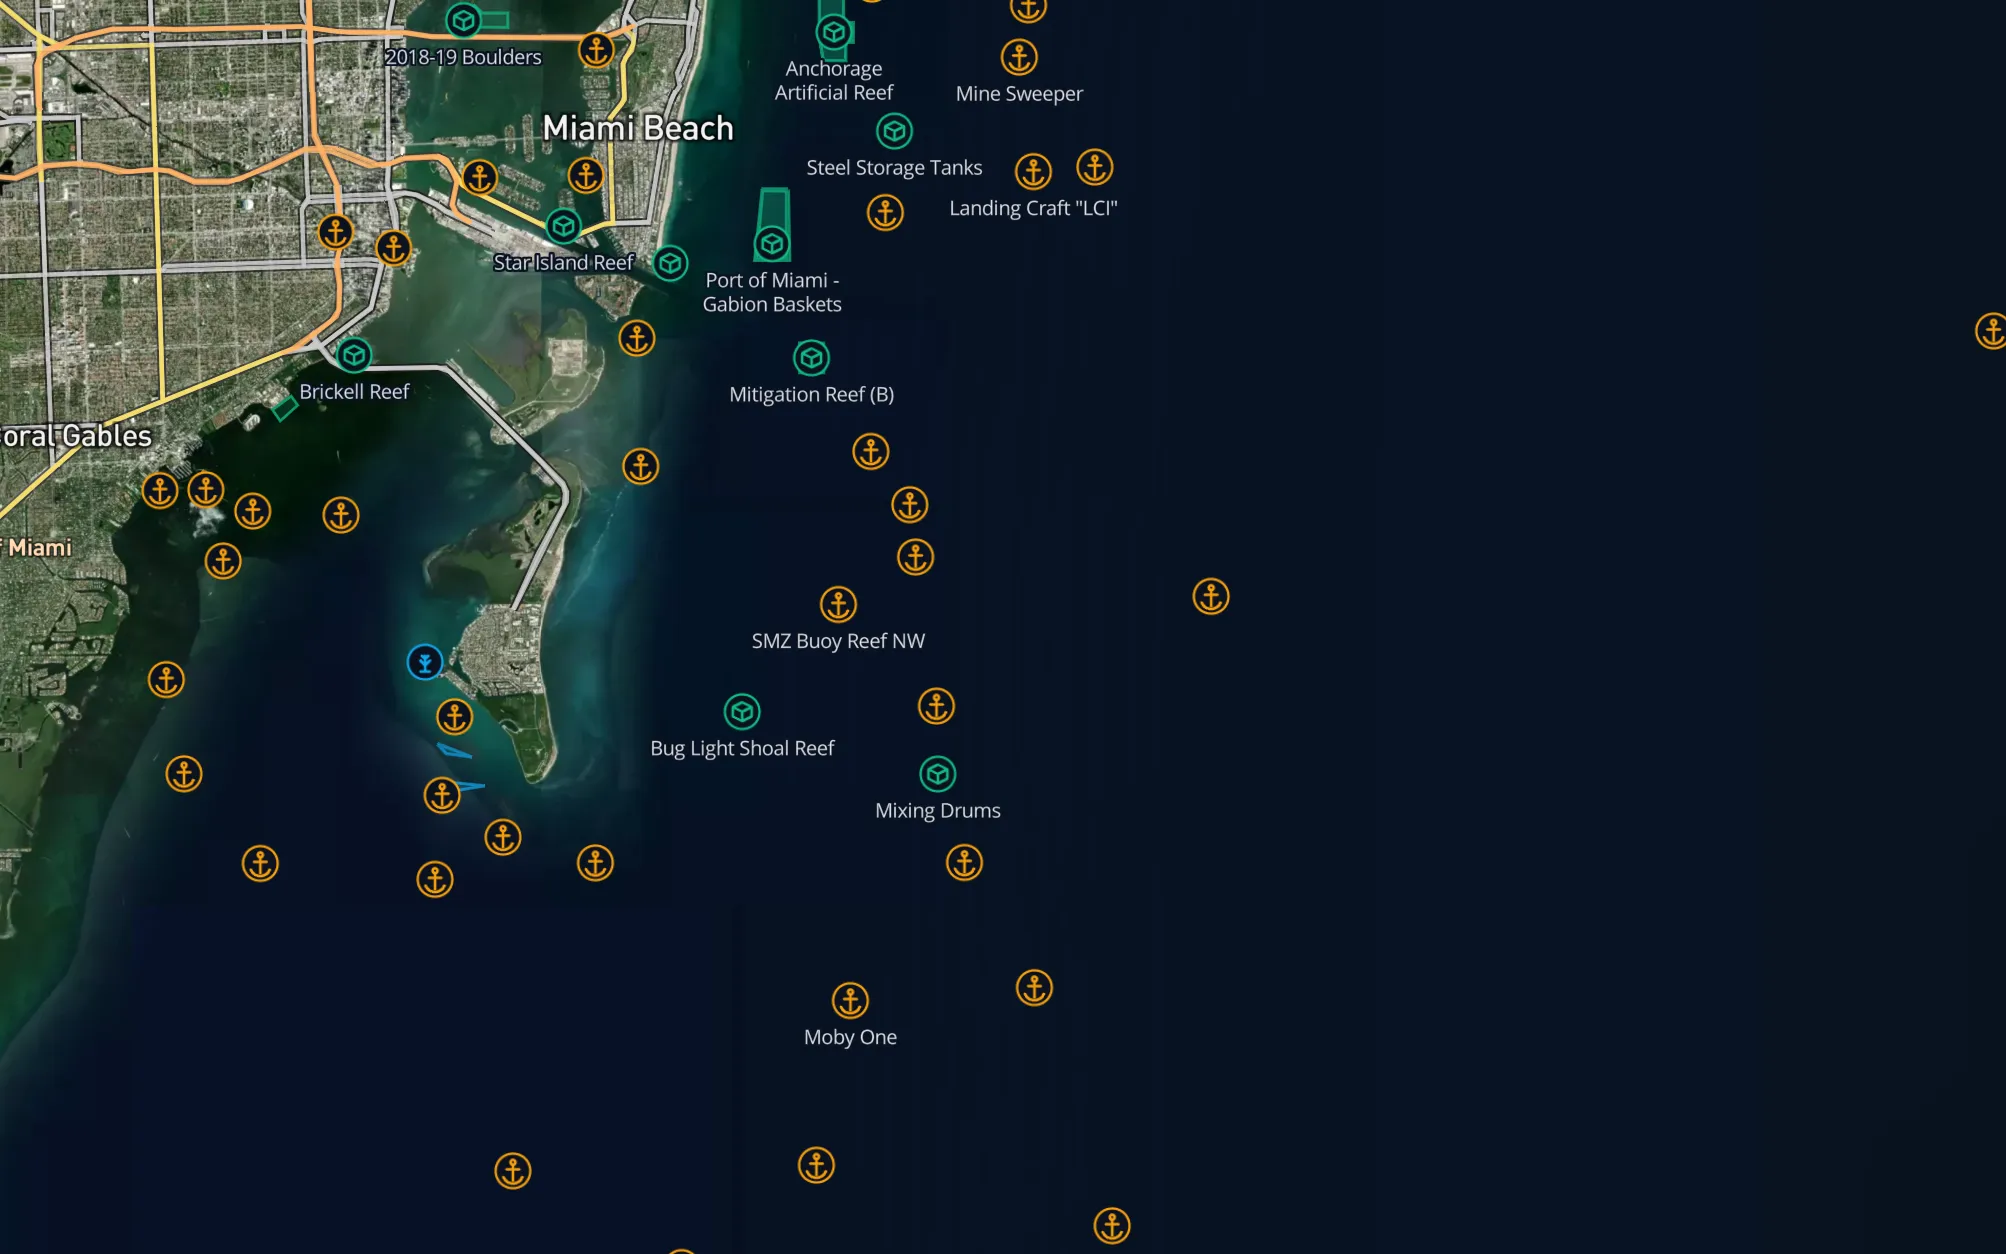
Five catalogues, one set of pins.
Every structure on the map comes from one of these sources, and many come from more than one:
- NOAA electronic nautical charts. The wrecks, obstructions and underwater rocks charted in US waters, from every chart scale.
- Florida FWC artificial reefs. The state's own record of reef deployments.
- BOEM platforms. Offshore oil and gas platforms in the Gulf of Mexico.
- OpenStreetMap. Wrecks, reefs and named dive sites mapped by volunteers worldwide.
- A Wikipedia derived wreck list. Shipwrecks worldwide, positioned from encyclopedia entries.
The result is more than 380,000 reefs, wrecks, obstructions, dive sites and platforms as of August 2026. It's dense in US waters and sparse elsewhere. Reef areas are drawn as shapes, not pins. The NOAA, FWC, BOEM and wreck list sources refresh every week.
One pin for each object.
Catalogues disagree. Florida FWC and OpenStreetMap put the USCGC Duane about 4 km apart, so the same wreck can turn up twice. When two records look like the same object, the map merges them into one pin. That means their names agree closely and they sit within 5 km of each other (up to 15 km when a source is coarsely positioned), or they share a ship's IMO number. A record with no name needs to sit much closer, within a tight distance scaled to how precise each source is.
Plenty of things stay separate on purpose. Two different names at one position stay two objects, and so does a wreck lying on a natural reef. Numbered deployments like Site 12 and Site 13 never merge. And records from Florida FWC, from BOEM, or from one NOAA chart scale are never merged with each other, so a field of reef modules stays a field of modules. When records do merge, the pin goes where the most precise source puts it, and each detail comes from the best source that has it.
What you see when you tap one.
The seabed depth beside the structure, as the charting source reports it. When no source has one, the app shows an estimate from global bathymetry, labelled Bottom (est.).
The depth over the shallowest point of the structure itself, where a chart sounding exists. It's what you reach first on the way down.
Height above the seafloor where a source gives it, and how far the structure sits from the nearest shore.
A badge reading Surveyed, Single source, or how many sources agree, with each source listed and credited.
Water temperature, wind, waves, weather and the visibility estimate at the site.
Pin it to your spots, set it as your location to see the full conditions there, or share it. Pinning and sharing need a free account, and a shared link lasts 12 hours.
Where a source has them you also get the material, the date sunk or deployed, notes and a Wikipedia link. If a position is less accurate than 100 m, the panel says so, and you can open the spot in Apple Maps or Google Maps.
The layers that go with it.
Depth shading and contours worldwide. In US waters, NOAA BlueTopo adds relief detailed enough to read the drop offs around a wreck.
The official US nautical charts, with soundings and depth contours. US waters only.
Live coral, sand, rubble and seagrass from the Allen Coral Atlas, across tropical reef waters.
Satellite sea surface temperature from NASA, for spotting where warmer and cooler water meet.
All of these are Pro layers. The NOAA Chart, Reef Habitat and water temperature layers need a connection. With Pro offline areas you can also save the bathymetry and the reefs and wrecks for a box you pick, so they stay on your phone when you lose signal.
By region.
Florida
Florida has a deep catalogue. Florida FWC's artificial reef deployments sit alongside the wrecks, obstructions and underwater rocks on NOAA charts, from the Panhandle down to the Keys, and the Keys fall inside the Reef Habitat layer's tropical coverage.
New York and New England
Around Montauk Point and Block Island the layer is mostly what NOAA charts log: wrecks, obstructions and underwater rocks, with the chart's depth where it has one. Turn on the NOAA Chart layer underneath to read the soundings and contours around them.
California
California's pins are mostly the wrecks and obstructions on NOAA charts, plus what OpenStreetMap volunteers have mapped. When your pin resolves to a place in California, which an offshore pin often doesn't, the Fish tab carries CDFW rules for 22 species, with license information.
Hawaii
NOAA charts cover Hawaiian waters, so charted wrecks and obstructions show around the islands. Hawaii also sits inside the Reef Habitat layer, which maps live coral, sand, rubble and seagrass, useful for reading the bottom between pins.
Gulf of Mexico
BOEM's federal records put the Gulf's offshore oil and gas platforms on the map, next to NOAA chart wrecks and, along the Florida Panhandle, FWC artificial reefs.
Outside the US, the pins come from OpenStreetMap and the Wikipedia derived wreck list. They're sparser, often unnamed, and some wartime losses are positioned tens of kilometres from where the hull really lies.
What the map can't tell you.
- It's a Pro layer. Without Pro you can open one structure someone shares with you, for 12 hours.
- Positions outside US waters can be coarse. Records taken from encyclopedia entries can be off by tens of kilometres for wartime losses.
- The depth beside a structure may be an estimate from a grid about 2 km across, and it can be well off over a wall or a pinnacle. Many structures have no least depth at all.
- It doesn't mark marine protected areas or no take zones. Check the local rules before you shoot.
- It shows structure, not fish. Whether anything is home is up to you.
Common questions.
More than 380,000 mapped reefs, wrecks, obstructions, dive sites and platforms as of August 2026, merged from NOAA electronic nautical charts, Florida FWC artificial reefs, BOEM platforms in the Gulf of Mexico, OpenStreetMap and a Wikipedia derived wreck list. It's dense in US waters and sparse elsewhere. Tap any of them for the depth, the sources behind it and the conditions at the site.
Submarius maps the wrecks, obstructions and underwater rocks that NOAA charts log around Montauk Point and Block Island, with the chart's depth where one exists, and the NOAA Chart layer adds the soundings and contours. Both are Pro map layers. The map doesn't list anyone's private spots, and it shows structure, not fish.
Yes. In Florida the map combines Florida FWC's artificial reef deployments with the wrecks, obstructions and underwater rocks on NOAA charts, from the Panhandle to the Keys. It's a Pro layer. The Fish tab adds FWC rules for 22 species when your pin resolves to a place in Florida, which an offshore reef pin often doesn't.
Each one shows Bottom, the seabed depth beside it as the charting source reports it. When no source has a depth, the app fills in an estimate from global bathymetry on roughly a 2 km grid and labels it Bottom (est.). Where a NOAA chart sounding exists you also get Least depth, the depth over the shallowest point of the structure, and Relief, its height above the seafloor, where a source gives it.
It's a Pro layer. If someone shares a reef or wreck with you, you can open that one structure for 12 hours without Pro. Pro is $12.99 a month or $99 a year, each with a 7 day free trial, or $149 once with no trial, in US prices. Other countries differ.
With Pro offline areas, you pick a box and the app saves the bathymetry and the reefs and wrecks inside it to your phone, so they're there with no signal. The NOAA Chart, Reef Habitat and water temperature layers, forecasts and conditions need a connection.
Yes. Press and hold on the map to drop a spot. Spots are private, unlimited and stored on your device. Pinning a reef or wreck from the layer to your spots needs a free account.
Related.
- The Submarius spearfishing app, with conditions, fish rules and safety tools.
- Spearfishing conditions by location.
Find the structure, then check the water.
Today's conditions, safety tools and trip recording are free. Pro adds the 8 day forecast, the Pro map layers, cam playback and offline areas for $12.99 a month or $99 a year, or $149 once.